

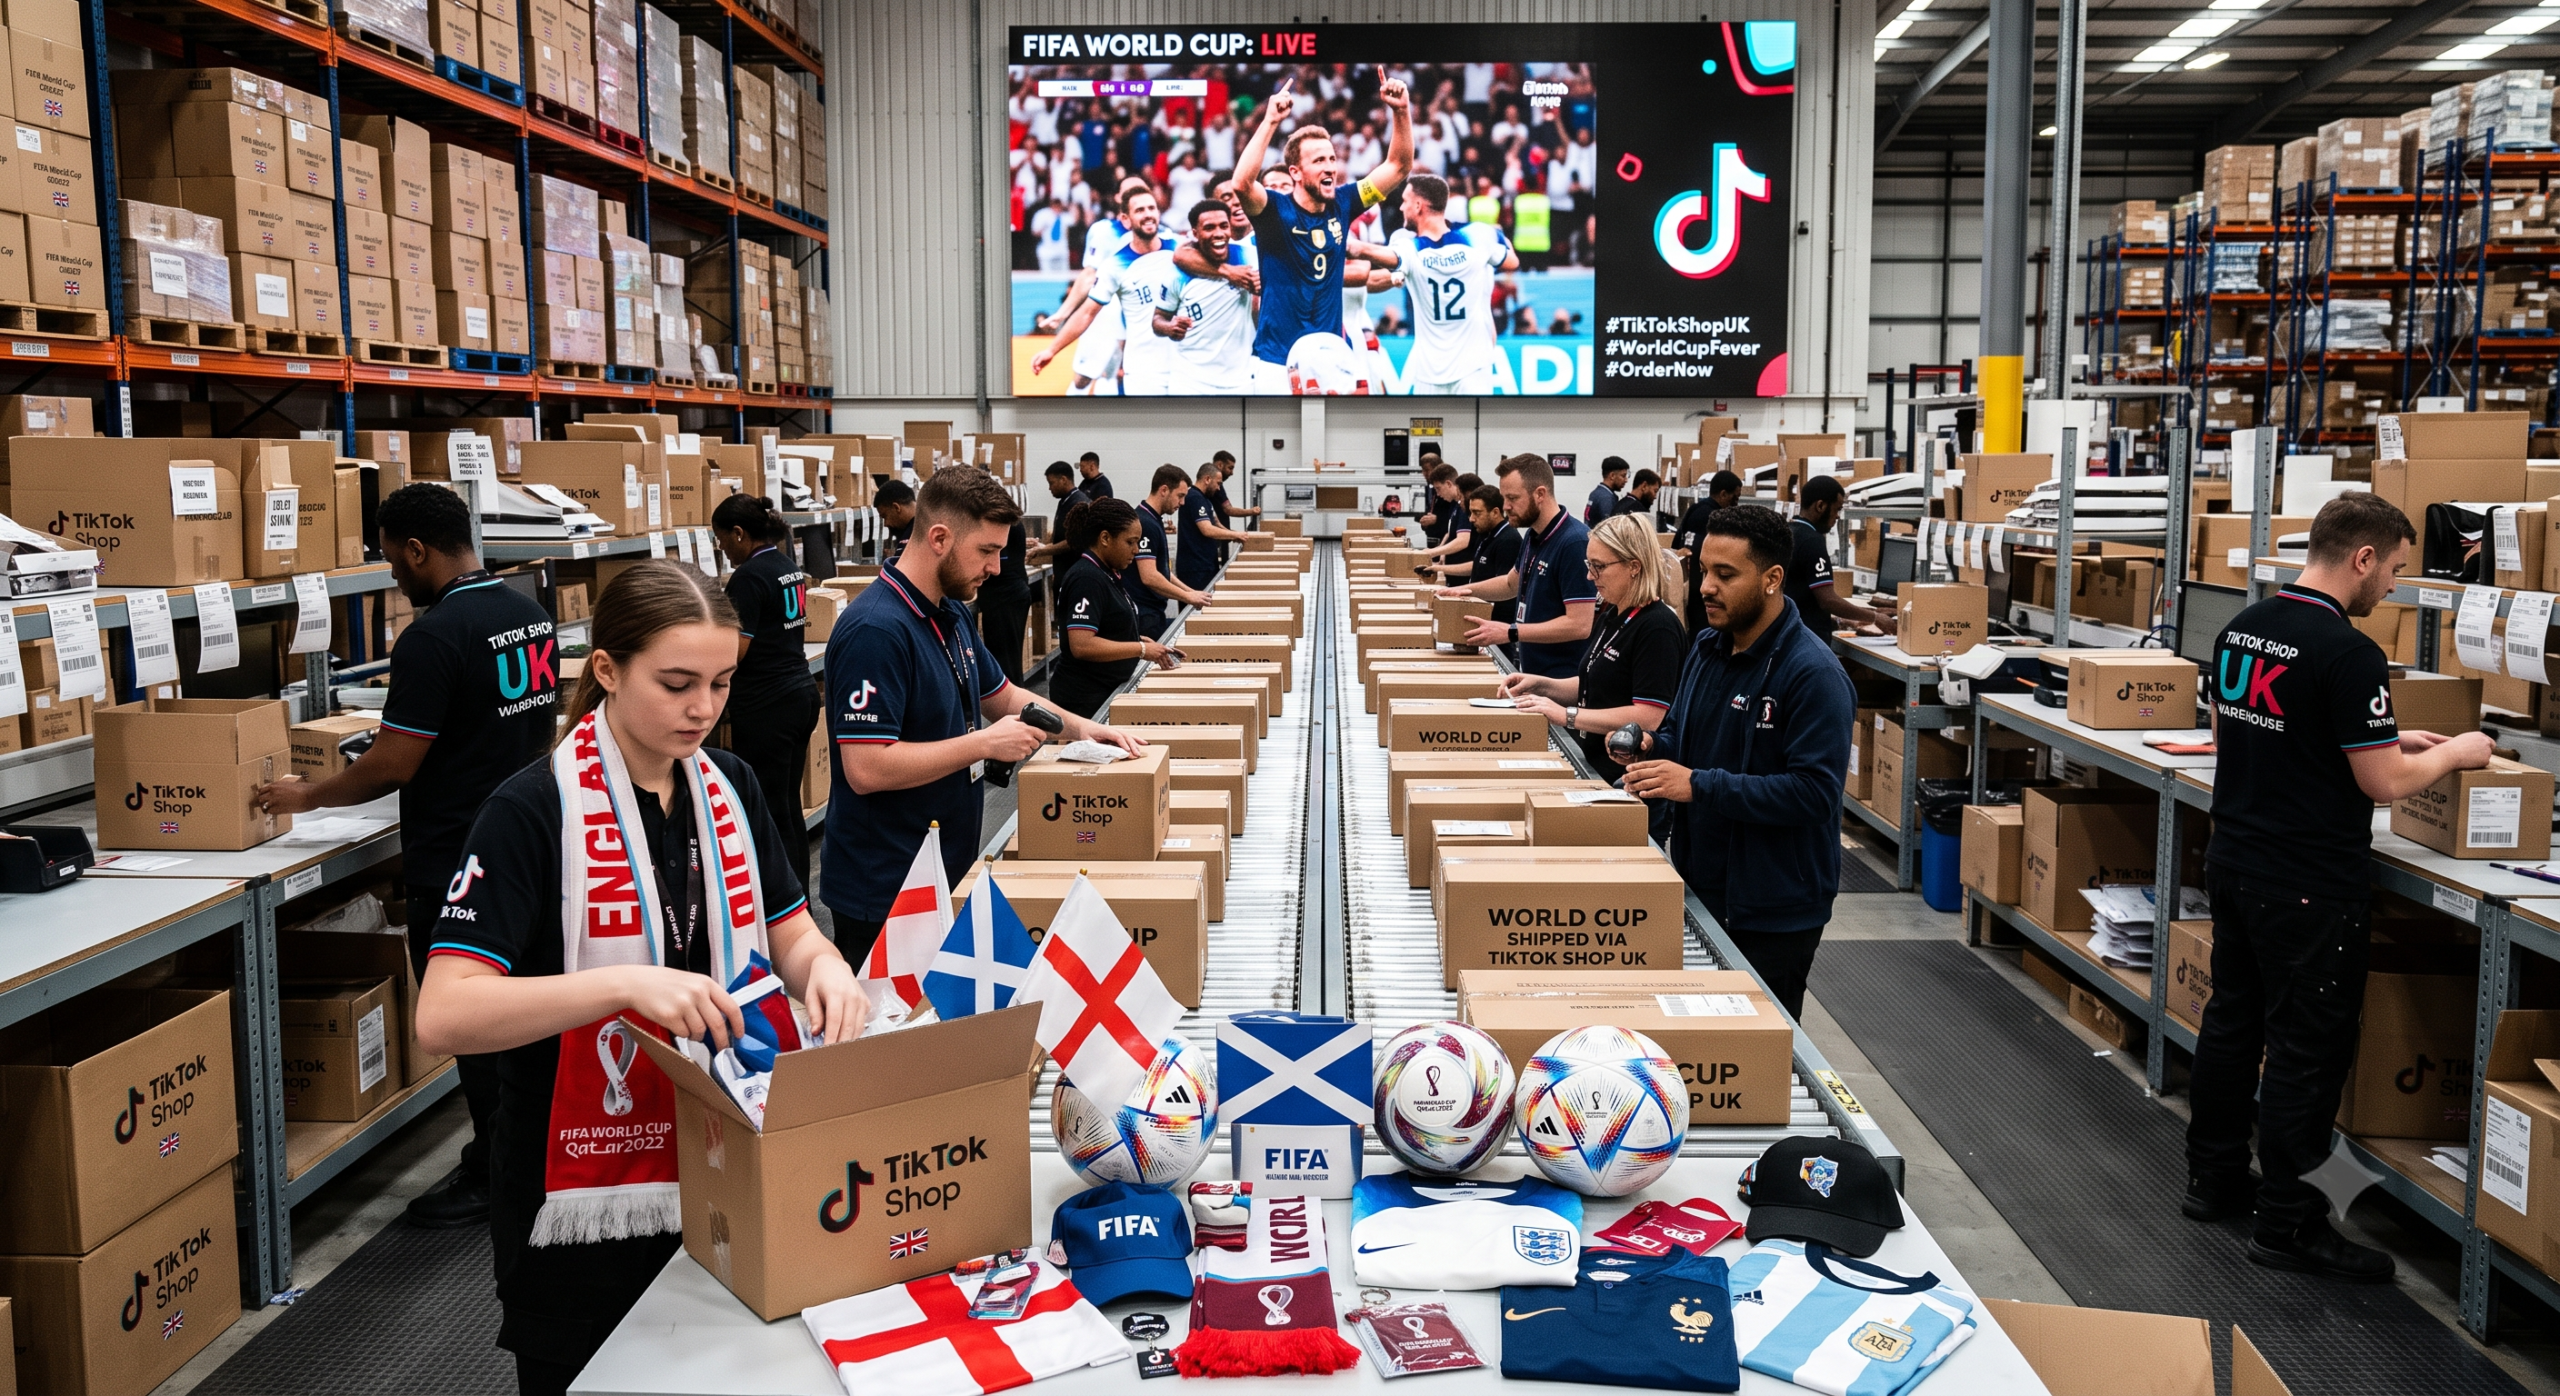
A tournament summer put sports collectibles into TikTok Shop’s UK feed at scale. For operators, the lesson is less about football and more about how fast a moment can move real volume, and how briefly the window stays open.
Every so often a single event does the work of a year of demand planning. This summer, in the UK, that event was the World Cup, and the channel that captured the surge most visibly was TikTok Shop. According to ChannelX, sports collectibles on TikTok Shop UK grew 136% from January to June, a figure that turns an abstract idea (live sport drives commerce) into something an operator can actually plan around.
We want to be precise about what that number is and is not. It is a growth rate reported by one outlet. ChannelX does not attribute the statistic, or the others in this story, to a named external dataset or research organisation; the figures read as TikTok Shop platform data and a single seller’s own business metrics. So we treat the whole set as ChannelX-reported and we do not stretch it further than the outlet does. What follows is a read of what these numbers mean for a European seller watching the same platform, not a claim that they are audited.
The shape of a tournament spike
The most useful thing about the ChannelX figures is that they show the timing of demand, not just its size. The 136% growth spans the full first half of the year, so it captures the pre-tournament build as well as the tournament itself. But the sharper movements sit inside the event window. Football shirt searches on TikTok Shop UK tripled since May, and orders were quadrupling since the World Cup kicked off. Search roughly 3x, orders roughly 4x, and orders climbing faster than search: that gap is the interesting part. It suggests intent was already high before the whistle and that the tournament converted browsers into buyers rather than simply attracting new lookers.
The most extreme reading came from a single query. Searches for the “England World Cup Kit” rose 2,000% in the first two weeks of the tournament, per ChannelX. A twentyfold jump in a fortnight is not a trend an operator grows into; it is a wave that arrives, crests, and recedes on the rhythm of fixtures and results. For anyone selling into it, the planning question is not whether demand exists but whether stock, listings and creator relationships are already in place when the two-week window opens, because there is no time to build them once it does.
The distinction matters because most sellers instinctively treat demand as something to chase. A 2,000% spike inverts that logic. By the time the surge is visible in a dashboard, the sellers capturing it are the ones who committed inventory, wrote listings and briefed creators weeks earlier, when the outcome was still uncertain. The operators who lose in a moment like this are rarely the ones with the wrong product; they are the ones who were right but late. On a channel where the interval between a search spike and an order spike is measured in days, being early is not a nice-to-have, it is the whole game.
Tool comparison · FastMoss vs Kalodata
A 2,000% search spike is only useful if you can see it forming. TikTok Shop analytics tools like FastMoss and Kalodata exist to surface rising products, breakout search terms and the creators driving a category before the peak, so a moment like a World Cup kit surge is something you plan for rather than read about afterwards.
Comparison coming soon
FTC disclosure: this section names tools we may hold an affiliate relationship with. We only feature products relevant to the topic, and any comparison we publish will be based on our own testing.

From the publisher
Everything we know about running Amazon, in one course.
The commercial strategy, taught by operators who run our own brands.
The volume behind the emotion
Numbers like these can feel like hype until you attach them to the content engine underneath. ChannelX reports more than 15.7 million posts using World Cup hashtags since 11 June. That is the raw material of a TikTok Shop surge: not an ad budget, but a tide of user and creator content that a platform can attach a buy button to. When millions of posts carry the same cultural moment, the distance between watching a clip and tapping to buy collapses, and that is precisely what the 4x order figure describes.
This is where the story connects to the wider European picture. The half-billion-euro quarter that TikTok Shop’s four largest continental markets recorded was, on the reported data, overwhelmingly creator-driven. The UK memorabilia surge is the same mechanism shown in colour rather than in a spreadsheet: creators and a live cultural moment doing the selling, with the shop functioning as the checkout rather than the storefront. An operator who reads the World Cup story as “football did well” has missed it. The transferable lesson is that demand on this channel arrives through content and events, and the seller’s job is to be positioned inside that flow before it peaks.
It is worth naming the ceiling on all of this too. A tournament spike is, by definition, temporary and category-specific. The 136% figure will not compound into a permanent doubling of collectibles demand, and the England kit surge will decay as the fixtures end. Operators should read these numbers as evidence of how fast the channel can move volume around a moment, not as a promise that the moment lasts.
Tool comparison · FastMoss vs Kalodata
Content volume is only actionable if you can trace which posts and creators convert. Category and creator analytics platforms such as FastMoss and Kalodata are built to tie a hashtag wave to the shops and products actually moving units, which is the difference between watching 15.7 million posts scroll by and knowing where the orders are coming from.
Comparison coming soon
FTC disclosure: tools named here may be ones we have an affiliate relationship with. We feature only tools relevant to the story, and any published comparison will rest on our own hands-on testing.
When a single item clears four figures
The headline that travels furthest from this story is a single object. During a live shopping session, ChannelX reports, a signed Maradona jersey sold for over £1,000, described as the largest live sale that the seller, Fan Cave Memorabilia, had made to date. One item, one live stream, four figures. For most sellers the practical takeaway is not that they should chase signed Maradona shirts, but that live shopping compressed a high-consideration, high-ticket sale into a single session driven by moment and personality.
That is a different motion from the everyday listing. A £1,000 collectible does not usually move on a static product page to a cold shopper; it moves when a trusted host, a live audience and a cultural high point line up at the same time. The World Cup supplied the cultural high point for free. The seller supplied the format. TikTok Shop supplied the checkout. For an operator, the composable lesson is that the live format can carry price points that the standard feed cannot, provided the moment is right and the host is credible.
There is a reason live works at this price point that generalises well beyond memorabilia. A high-ticket, high-consideration purchase normally stalls on the questions a static page cannot answer in the buyer’s own timing: is it genuine, what is the provenance, why is it worth this much today. A live host answers those in real time, in front of an audience whose collective enthusiasm becomes its own form of proof. The format compresses the trust-building that would otherwise take a sequence of touchpoints into a single window. Any European seller with a considered product and a credible presenter can borrow that mechanism; the football context is incidental to it.
What a European operator should take from this
Strip away the football and three things remain that apply to any TikTok Shop seller in Europe. First, demand on this channel is event-shaped and content-shaped, so the calendar of cultural moments is a planning input, not background noise. Second, the gap between a search spike and an order spike is small on TikTok Shop, which rewards sellers who are already in position rather than those who react. Third, the live format can move volume and value that a static listing cannot, which makes it worth testing well before the moment you most want it to work.
We would add the discipline that runs through this whole piece. Every figure here comes from one outlet, ChannelX, and none of it traces to a named dataset. That does not make the story less real; the direction of travel is corroborated by the broader European TikTok Shop picture. It does mean an operator should treat the exact percentages as indicative rather than precise, and should validate the pattern against their own category before committing stock to the next tournament summer. The signal is clear. The decimal points are not the point.
Sources
ChannelX, “TikTok Shop sports memorabilia grows 136% from January to June,” July 2026 (https://channelx.world/2026/07/tiktok-shop-sports-memorabilia-grows-136-from-january-to-june/). Note on sourcing: all figures are as reported by ChannelX; the outlet does not attribute its statistics to a named external dataset. Figures should be read as indicative, not audited.
 Erene Araojo