

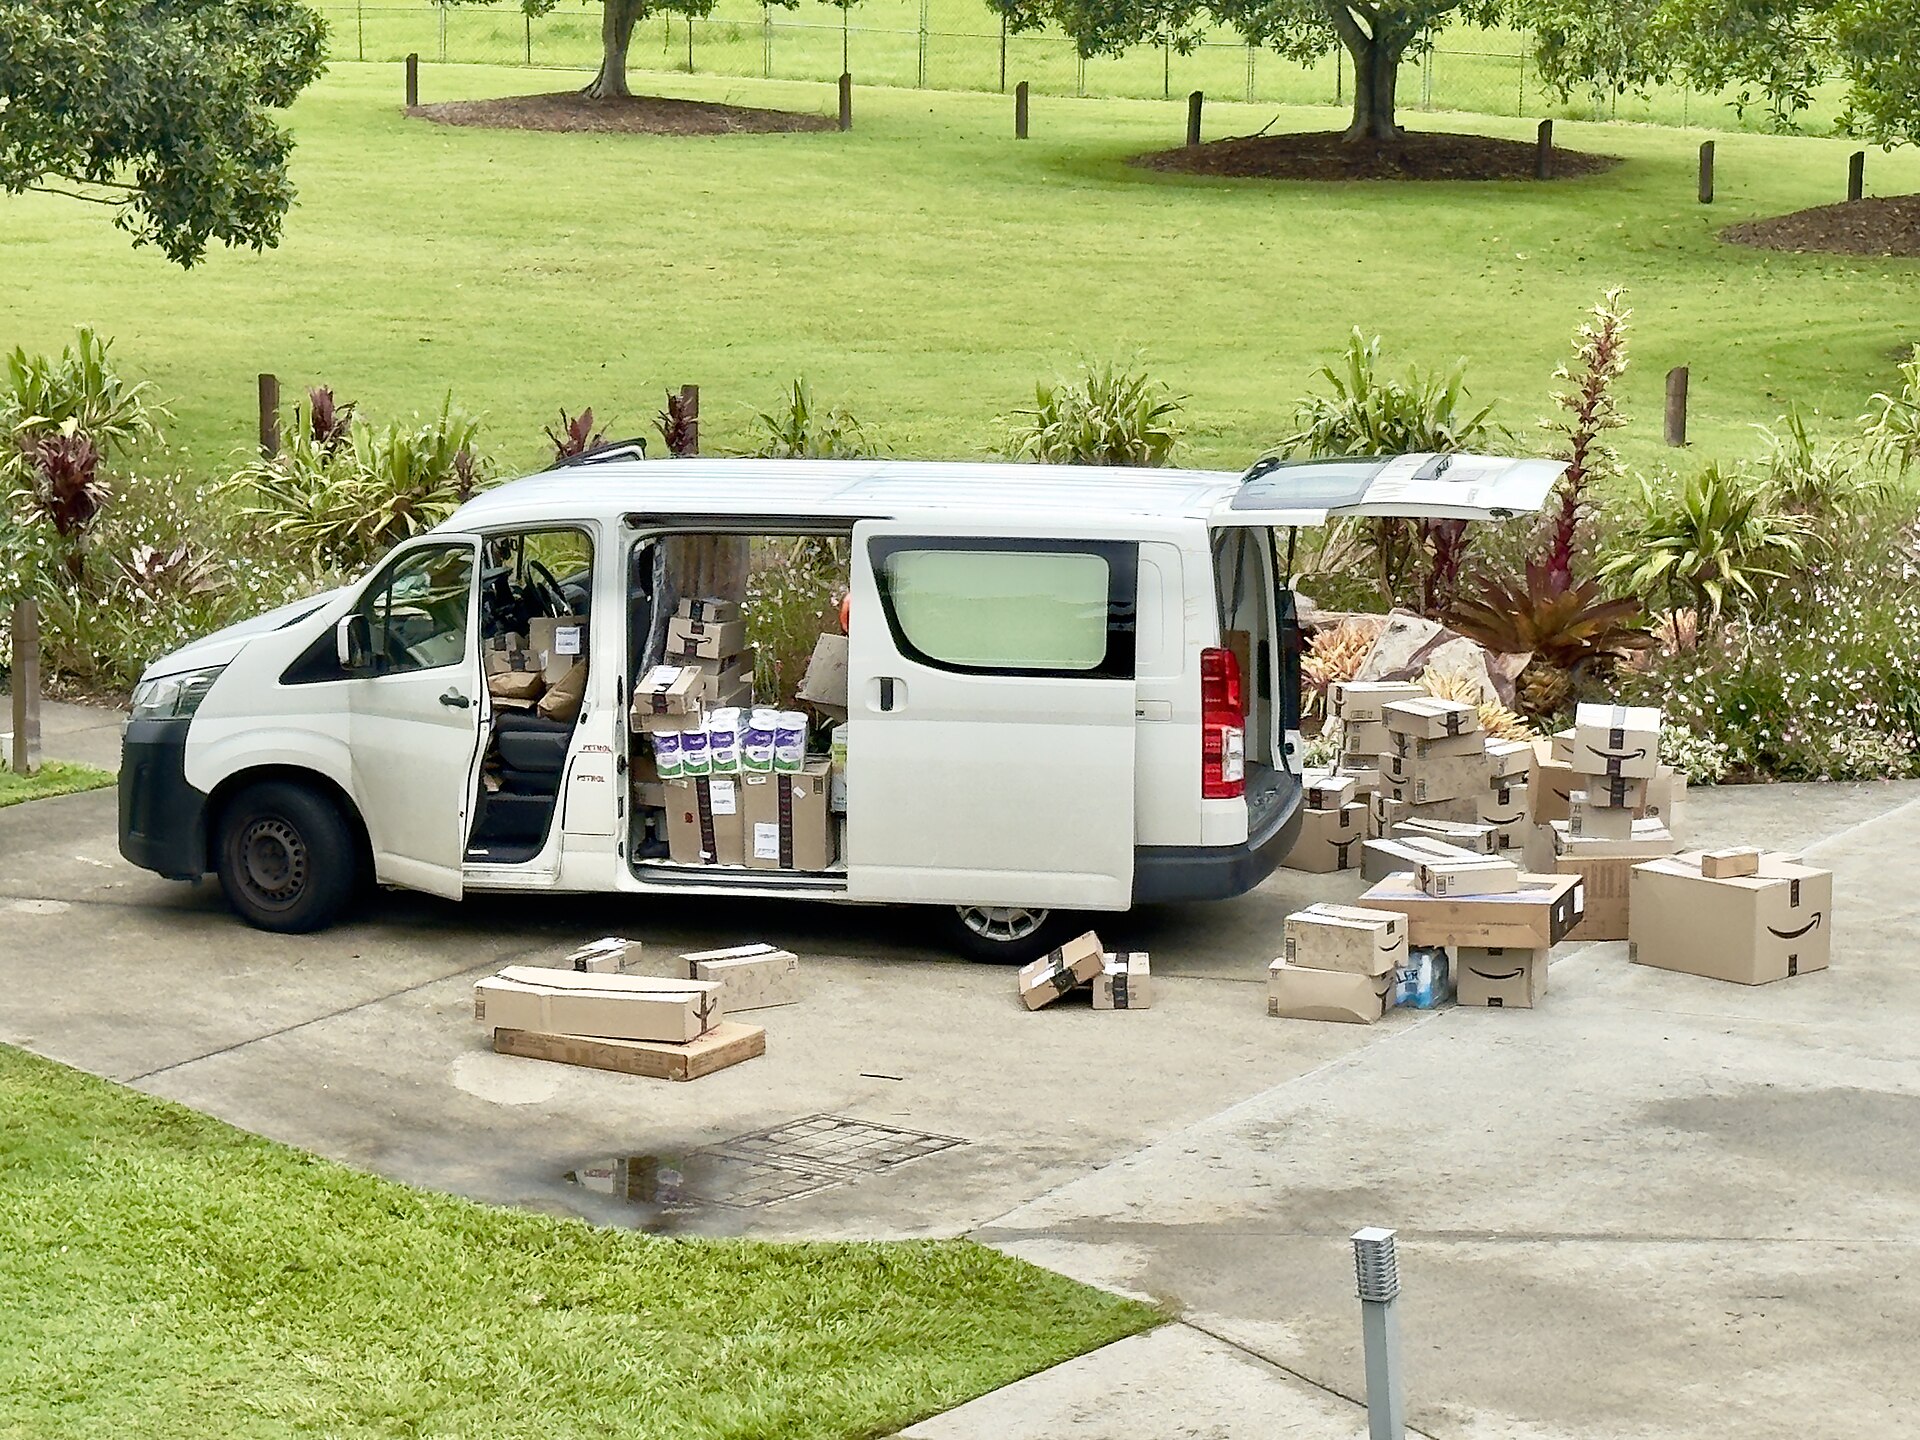
Amazon Prime Day 2026 closed as the biggest one yet, and the way shoppers spent tells sellers more than the headline number does. Over the four-day event from June 23 to June 26, 2026, U.S. online shoppers spent $26.4 billion, a 9.3% increase over the same event a year earlier, according to Adobe Analytics data reported by Retail Dive. Two shifts underneath that total matter more than the total itself: buyers traded up into the most expensive electronics, and a growing share of them reached for buy-now-pay-later to do it. For operators on Amazon and TikTok Shop, that combination is the real story, and it points to concrete moves you can make before the next peak window.
We want to be precise about what the record does and does not say. It says demand held up and even grew in a period when consumers have been watching their wallets. It does not say every category rose evenly or that the average shopper suddenly had more cash. The distribution of the spend is where the operator lesson lives, so we will walk through it figure by figure and then translate each into something you can act on.
The headline: a record, but a shifted one
The $26.4 billion figure covers U.S. e-commerce spend across the full four-day event, per Adobe Analytics as reported by Retail Dive and corroborated by Digital Commerce 360. The 9.3% year-over-year growth is the number to anchor on, because it sets the baseline expectation for the category. If your store grew slower than roughly 9% over this window, you did not keep pace with the event; if you grew faster, you took share.
One structural detail shapes how you read the comparison. The 2026 event ran in late June, moved up from its July slot in 2025. That timing shift matters for anyone comparing this year’s June numbers against last year’s July numbers in their own dashboards. When you benchmark your store against the 9.3% category figure, make sure you are comparing the same four-day event window and not a fixed calendar month, or you will draw the wrong conclusion about your own performance.
The takeaway for operators is simple to state and easy to get wrong: a rising tide lifted the category by about 9.3%, and your job is to know whether you rode it. That means pulling your own event-window revenue against the prior event, not against a random week, before you decide whether Prime Day worked for you.
Tool comparison · FastMoss vs Kalodata
To benchmark your own event-window performance against the category, you need clean TikTok Shop and creator data, not guesswork. FastMoss leans toward broad product and shop discovery; Kalodata leans toward deeper creator and video-level revenue analytics. If your Prime-window question is “which of my products moved and why,” compare how each tool slices event-window sales before you commit.
Compare FastMoss vs Kalodata →
FTC disclosure: E-CommSphere may earn a commission if you subscribe through our links, at no extra cost to you. We only feature tools we would use ourselves, and our comparisons are editorial.

From the publisher
Everything we know about running Amazon, in one course.
The commercial strategy, taught by operators who run our own brands.
The trade-up: expensive electronics led the way
The most telling shift is at the top of the price ladder. Adobe found that the share of the most expensive goods in electronics jumped by 51%, according to Retail Dive. Read that carefully: it is not that electronics sales as a whole rose 51%, but that within electronics, the highest-priced tier grew its share by that amount. Shoppers who came for a deal did not only buy cheap; a meaningful group traded up into premium.
Retail Dive also noted that shoppers traded up in categories including toys, appliances and furniture, which tells us the premium appetite was not confined to a single aisle. The pattern is consistent: deep discounts during the event gave buyers permission to reach for the higher-priced item they had been eyeing, and they took it.
For a seller, this reframes the discounting question. The reflex during a peak event is to lead with your cheapest SKU to win the click. This data suggests the opposite may be leaving money on the table. If you carry a good-better-best range, the event window is exactly when the “best” tier can move, because the discount lowers the psychological barrier on a premium price. We are not telling you to raise prices; we are pointing out that Adobe’s data shows the premium tier gaining share, and a store that only merchandises its entry SKU during the event may be missing the buyers who are actively trading up.
The operator move here is to make sure your premium listing is event-ready, not just your loss leader. That means the higher-priced SKU has its images, its bullets, its A-plus content and its review count in as strong a shape as your cheapest one, because the data says that is where a growing share of the spend went.
The financing: buy-now-pay-later kept climbing
The second shift is how people paid. Buy-now-pay-later orders jumped 9.5% compared to last year, according to Retail Dive, and Adobe data reported by Digital Commerce 360 puts BNPL at 6.6% of online orders during the period, accounting for $2.1 billion in spend. So BNPL is both growing at roughly the same pace as the overall event and now sits at a measurable, multibillion-dollar slice of it.
These two facts fit together. When shoppers trade up into higher-priced electronics and appliances, financing is often what makes the bigger ticket feel manageable. The rise in premium purchases and the rise in BNPL are not separate trends; they are two views of the same shopper stretching a budget to reach a nicer item during a discount window.
Tool comparison · FastMoss vs Kalodata
If you sell on TikTok Shop, watching which financing-friendly, higher-ticket products are trending is worth doing with real data. FastMoss casts a wider net across products and shops for discovery, while Kalodata goes deeper on creator-level and video-level revenue so you can see which content actually drove the sale. For spotting a rising higher-ticket item early, compare both on the same product.
FTC disclosure: E-CommSphere may earn a commission if you subscribe through our links, at no extra cost to you. We feature only tools we would use ourselves, and our comparisons are editorial.
For operators, the BNPL number is a prompt to check your own checkout and your own positioning. On Amazon, BNPL availability is largely platform-controlled, so the lever you hold is price-point psychology: a $180 item framed as a manageable monthly cost behaves differently in a shopper’s mind than the same item framed only as a lump sum. On TikTok Shop, where creator content sets up the purchase, the financing angle can live in the pitch itself, because the creator can speak to the value of the higher-ticket item that BNPL makes reachable.
The caution is equally real. BNPL growth means some of your higher-ticket sales are being made by buyers stretching to afford them, and that can carry a higher return and cancellation risk after the event glow fades. If your premium SKU sold well during the window, watch its return rate in the weeks after, because a trade-up bought on financing is more likely to come back than one bought outright.
What we would do before the next peak window
Pull three numbers together and the operator playbook writes itself. The category grew about 9.3%. The premium electronics tier grew its share by 51%. BNPL orders grew 9.5% and now sit at 6.6% of orders. The through-line is that this was a trade-up event financed at the margin, not a bargain-bin event.
First, benchmark honestly. Compare your event-window revenue to the prior event, not a normal week, and judge yourself against roughly 9% category growth. Second, merchandise your premium tier as hard as your entry tier, because that is where a growing share of the spend went. Third, respect the financing signal on both ends: use price-point framing to make higher tickets feel reachable during the window, and watch post-event returns on anything that sold on a stretch.
None of this requires a bigger ad budget. It requires reading the shape of the spend rather than the size of it. The record was real, but the record is not the lesson. The lesson is that shoppers came to a discount event and traded up, and the sellers who win the next one will be the sellers who had their better and best products ready for them.
Sources
- Retail Dive, “Amazon’s Prime Day drives online sales in the US up 9.3%”: retaildive.com
- Digital Commerce 360, “Amazon Prime Day effect in 2026: $26.4B in U.S. ecommerce sales”: digitalcommerce360.com
- Adobe Analytics (primary data provider cited by both outlets above)
 Erene Araojo