
Most Amazon sellers can tell you their ACoS.
Far fewer can tell you their TACoS.
And that’s usually where the problem starts.
A seller sees a beautiful 18% ACoS and assumes the account is healthy. Meanwhile, ad spend is climbing, organic rankings are slipping, and profitability is getting squeezed. The metric looks great. The business doesn’t.
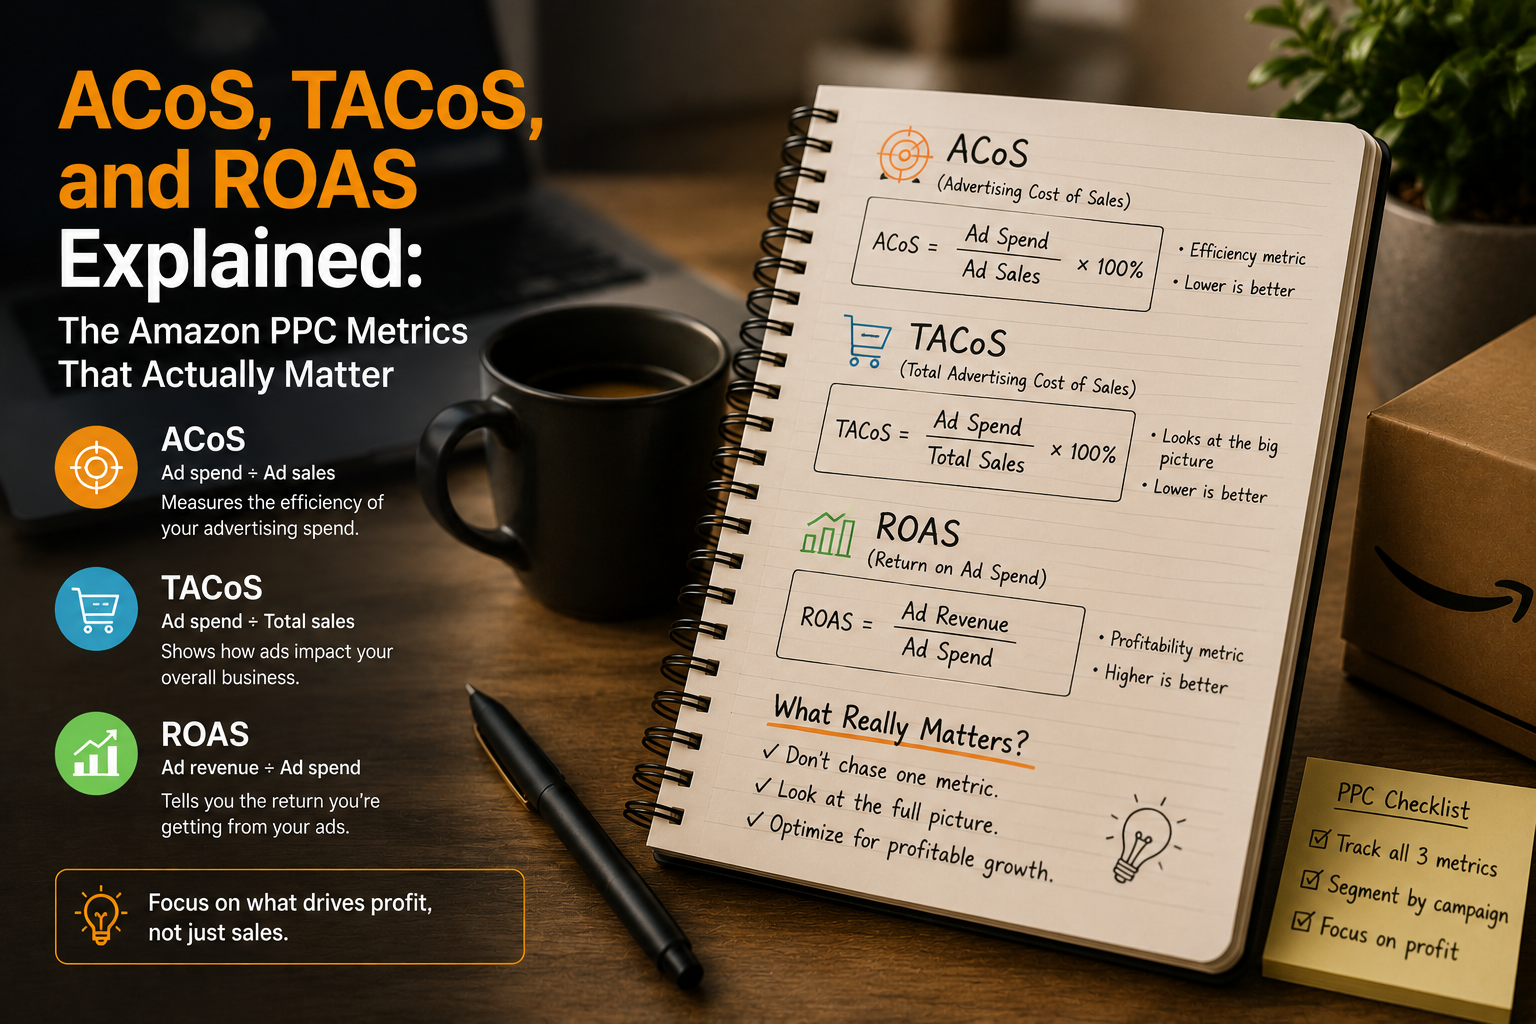
ACoS, TACoS, and ROAS all measure advertising performance, but they answer different questions. Understanding the difference is what separates campaign optimization from actual business growth.
TL;DR
- ACoS tells you how efficiently your ads generate attributed sales.
- ROAS is the inverse of ACoS and shows how much revenue you earn for every dollar spent on ads.
- TACoS includes all sales, not just ad-attributed sales, making it a better indicator of long-term account health.
- A low ACoS is not automatically good if organic sales are shrinking.
- Most mature Amazon brands track all three metrics together, not in isolation.
What Is ACoS?
ACoS (Advertising Cost of Sales) measures how much you spend on advertising to generate ad-attributed revenue. Amazon defines ACoS as ad spend divided by advertising sales.
Formula
ACoS=Ad RevenueAd Spend×100
Example
Suppose:
- Ad spend: $500
- Ad-attributed sales: $2,500
ACoS=2500500×100=20%
Your ACoS is 20%.
In practical terms, you’re spending $0.20 on ads for every $1.00 generated through advertising.
Why ACoS Matters
ACoS is the metric most Amazon PPC managers use to evaluate campaign efficiency.
A lower ACoS generally means:
- Better keyword targeting
- Better conversion rates
- More efficient ad spend
A higher ACoS generally means:
- Expensive clicks
- Poor conversion rates
- Aggressive growth spending
The catch is that ACoS only measures sales Amazon attributes to ads. It doesn’t tell you what’s happening to the rest of your business. Amazon itself notes that ACoS should not be the only metric used to evaluate campaign performance.
For a deeper dive into campaign structure, see [link to forthcoming “Amazon PPC Campaign Structure Explained” explainer].
What Is ROAS?
ROAS (Return on Ad Spend) measures how much revenue you generate for every dollar spent on advertising.
Amazon defines ROAS as total attributed sales divided by total advertising spend.
Formula
ROAS=Ad SpendAd Revenue
Example
Using the same numbers:
- Ad spend: $500
- Ad-attributed sales: $2,500
ROAS=5002500=5
Your ROAS is 5x.
For every $1 spent on ads, you generate $5 in revenue.
ACoS vs ROAS
These metrics are effectively mirror images of each other.
| Metric | Formula | What It Measures |
|---|---|---|
| ACoS | Ad Spend ÷ Ad Revenue | Cost efficiency |
| ROAS | Ad Revenue ÷ Ad Spend | Revenue return |
| Relationship | ROAS = 1 ÷ ACoS | Same data, different perspective |
Amazon explicitly describes ROAS as the inverse of ACoS.
Quick Conversion Examples
| ACoS | ROAS |
|---|---|
| 10% | 10x |
| 20% | 5x |
| 25% | 4x |
| 33% | 3x |
| 50% | 2x |
Some agencies prefer ROAS because executives tend to think in revenue generated. Most Amazon operators still default to ACoS because it’s easier to compare against profit margins.
What Is TACoS?
TACoS (Total Advertising Cost of Sales) expands the calculation by comparing ad spend against total sales rather than ad-attributed sales.
Formula
TACoS=Total RevenueAd Spend×100
Where:
- Ad Spend = Amazon PPC spend
- Total Revenue = Ad-attributed sales + organic sales
TACoS isn’t an official Amazon metric, but it has become one of the most useful measurements for understanding account-level growth.
Why TACoS Is Often More Important Than ACoS
Let’s look at two sellers.
Seller A
- Ad spend: $5,000
- Ad sales: $20,000
- Organic sales: $30,000
ACoS:200005000=25%
TACoS:500005000=10%
Seller B
- Ad spend: $5,000
- Ad sales: $20,000
- Organic sales: $5,000
ACoS:25%
TACoS:20%
Both sellers have identical ACoS.
One account is generating substantial organic demand. The other is heavily dependent on advertising.
That’s why experienced Amazon operators watch TACoS closely. It reveals whether ads are supporting organic growth or simply replacing it.
The Metric Most Sellers Misunderstand
A rising ACoS is not always bad.
Imagine:
| Month | ACoS | TACoS |
|---|---|---|
| January | 20% | 12% |
| February | 24% | 11% |
| March | 28% | 9% |
Many sellers would panic.
The smarter interpretation:
- Ads are helping improve keyword rankings.
- Organic sales are growing faster than ad spend.
- Total account efficiency is improving.
The opposite scenario is much more dangerous:
| Month | ACoS | TACoS |
|---|---|---|
| January | 20% | 10% |
| February | 18% | 12% |
| March | 16% | 15% |
Campaign efficiency appears to improve.
Account health is deteriorating.
Organic sales are disappearing and advertising is carrying more of the revenue burden.
What Is a Good ACoS?
There is no universal benchmark.
Amazon states that a good ACoS depends on factors such as margins, category competition, and business objectives.
The more useful number is your break-even ACoS.
Break-Even ACoS
Break-Even ACoS=Profit Margin
If your contribution margin is 30%, then:
- ACoS below 30% = profitable
- ACoS above 30% = unprofitable
Example
Product selling price: $40
Costs:
- Product cost: $10
- Amazon fees: $8
- Shipping and overhead: $6
Remaining profit before ads:
$16
Margin:4016=40%
Break-even ACoS = 40%
Anything below 40% remains profitable.
Anything above 40% starts destroying margin.
Tools for Tracking ACoS, TACoS, and ROAS
Amazon Advertising reports provide ACoS and ROAS directly.
The challenge is connecting advertising data with:
- Amazon fees
- Returns
- Cost of goods
- Inventory costs
- Net profit
That’s where Sellerboard becomes useful. Sellerboard combines Amazon advertising data with profitability reporting, allowing sellers to understand whether a strong ACoS actually translates into profit. It’s one of the few tools that helps connect PPC performance to real business outcomes rather than campaign metrics alone.
For a deeper comparison, see [link to forthcoming “Best Amazon Profit Tracking Tools” roundup].
Related reading: [link to forthcoming “How to Track Amazon Profit Accurately” how-to].
Common Mistakes
Obsessing Over ACoS
An account can have a fantastic ACoS and still be losing market share.
Ignoring TACoS
TACoS often reveals long-term trends months before they show up in profit reports.
Chasing Low ACoS at All Costs
Cutting bids aggressively can lower ACoS while reducing total sales.
Looking at Revenue Instead of Profit
A 10% ACoS sounds great until you discover your margins are only 8%.
FAQ
Is ACoS better than ROAS?
Neither is better. They measure the same relationship using different formulas. Amazon describes ROAS as the inverse of ACoS.
What is a good TACoS?
There is no universal benchmark. A declining TACoS combined with growing revenue is usually a positive signal.
Can I have a high ACoS and still be profitable?
Yes. Product launches, ranking campaigns, and aggressive growth phases often operate with temporarily elevated ACoS.
Why isn’t TACoS available in Amazon Advertising?
TACoS requires total account revenue data, not just ad-attributed sales, so sellers usually calculate it manually or through reporting tools.
Which metric should I prioritize?
Track all three. ACoS measures campaign efficiency. ROAS measures advertising return. TACoS measures whether advertising is helping the overall business grow.